Various projects
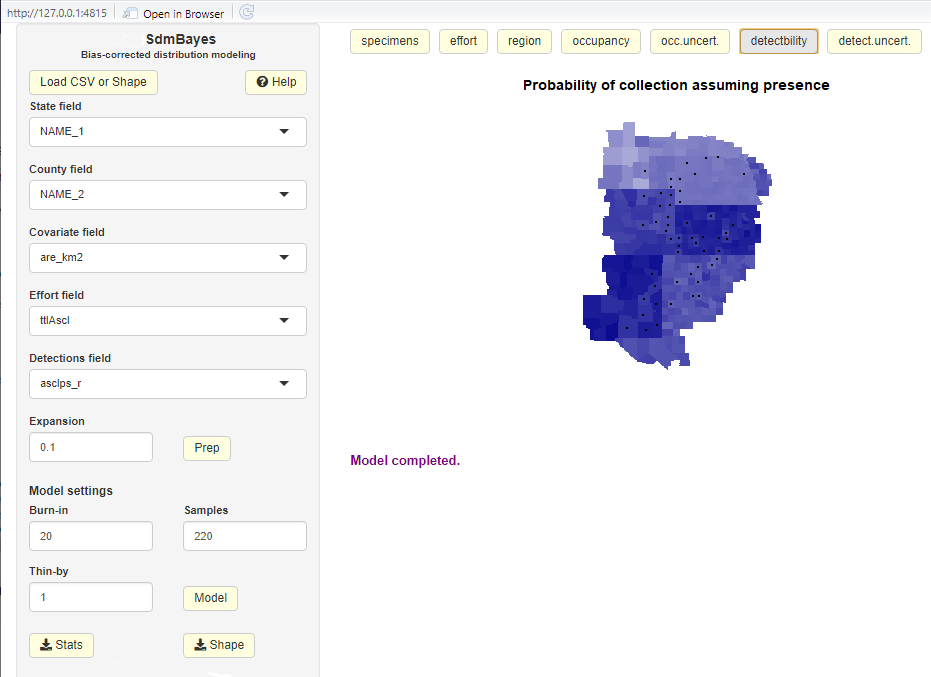
Shiny UI for distribution modeling app
• upload shapefiles in .csv, .zip or (.dbf,.shp,.shx,.prj) format• field and parameter selection and validation
• run preparation and modeling, display results as plots/tables, download
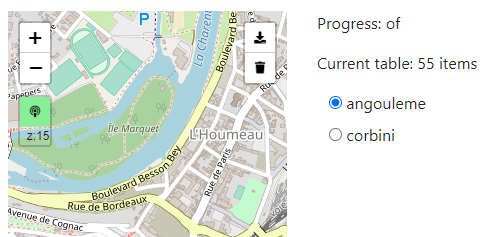
Offline Maps
leaflet.dexie is a Leaflet plugin for saving maps in local storage using library Dexie.js.Implements creation (and deletion) of maps for offline viewing, with demo hosted on Github.
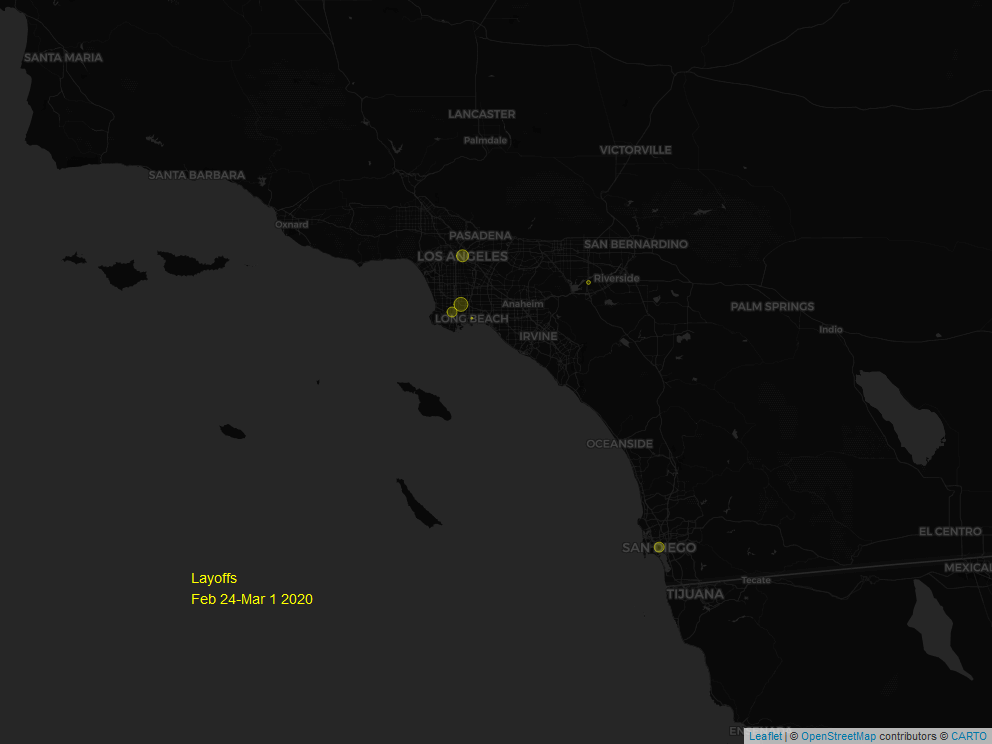
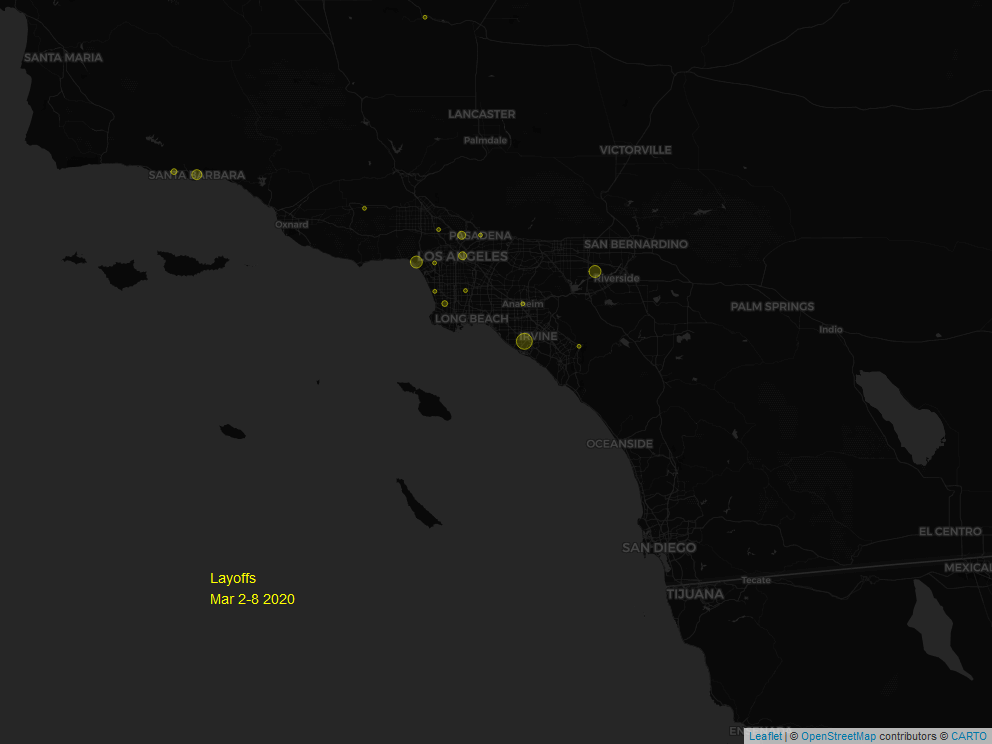
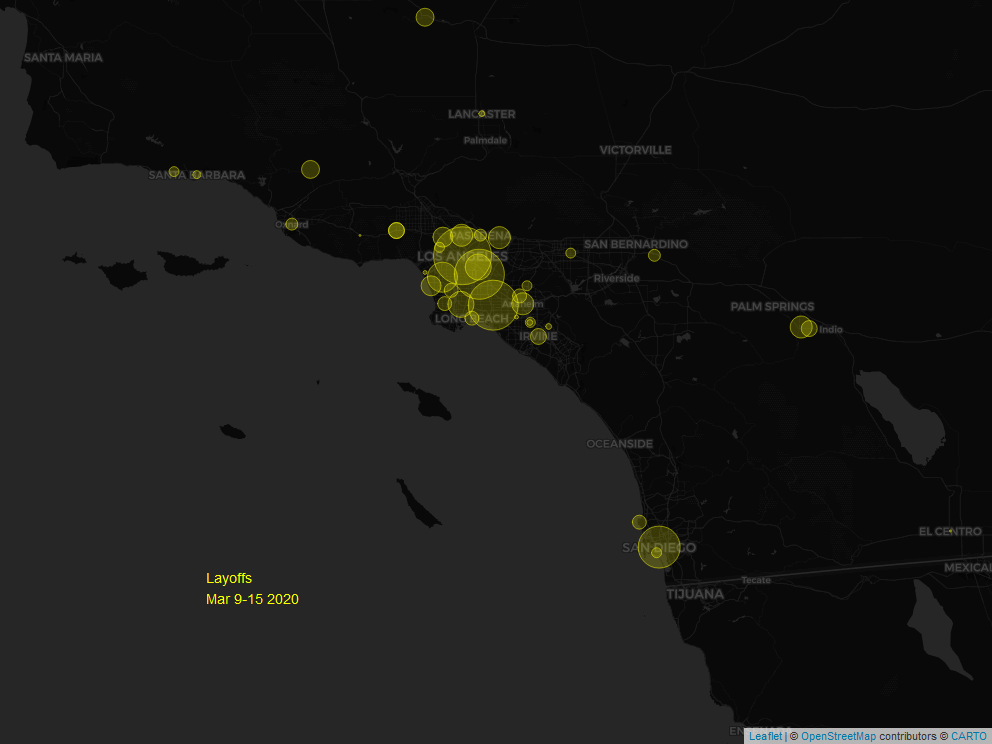
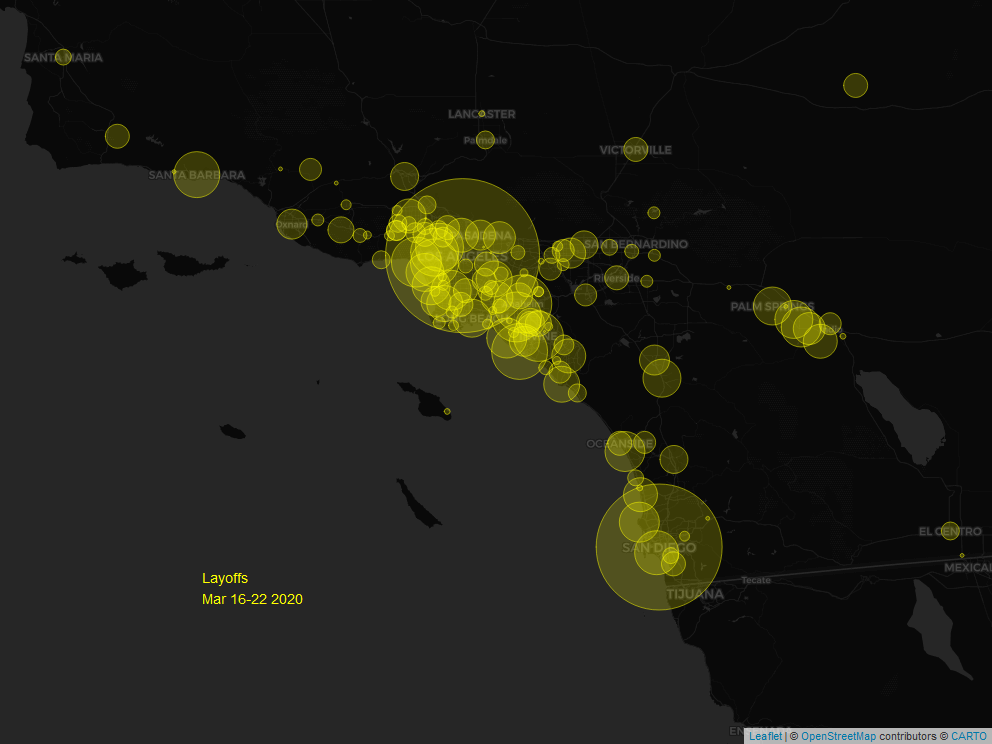
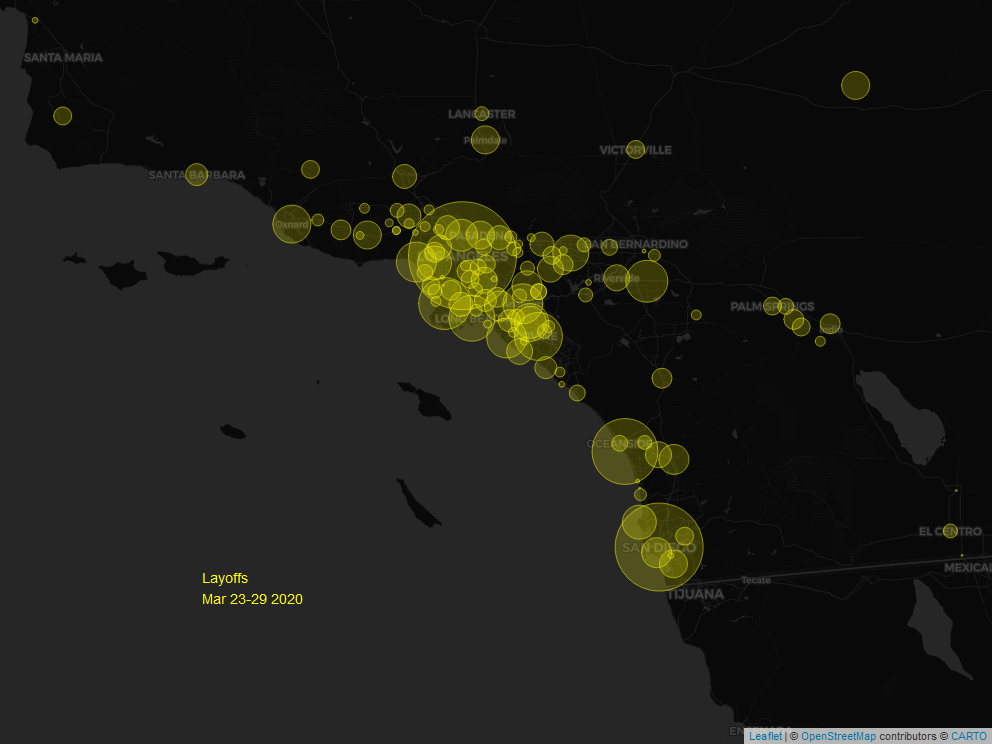
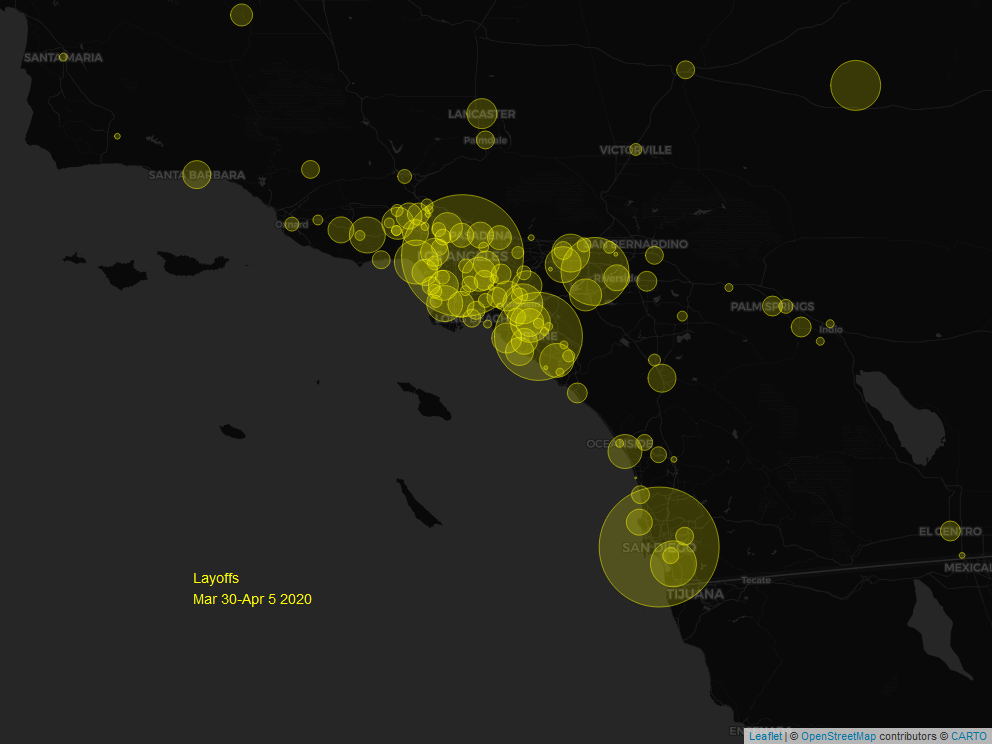
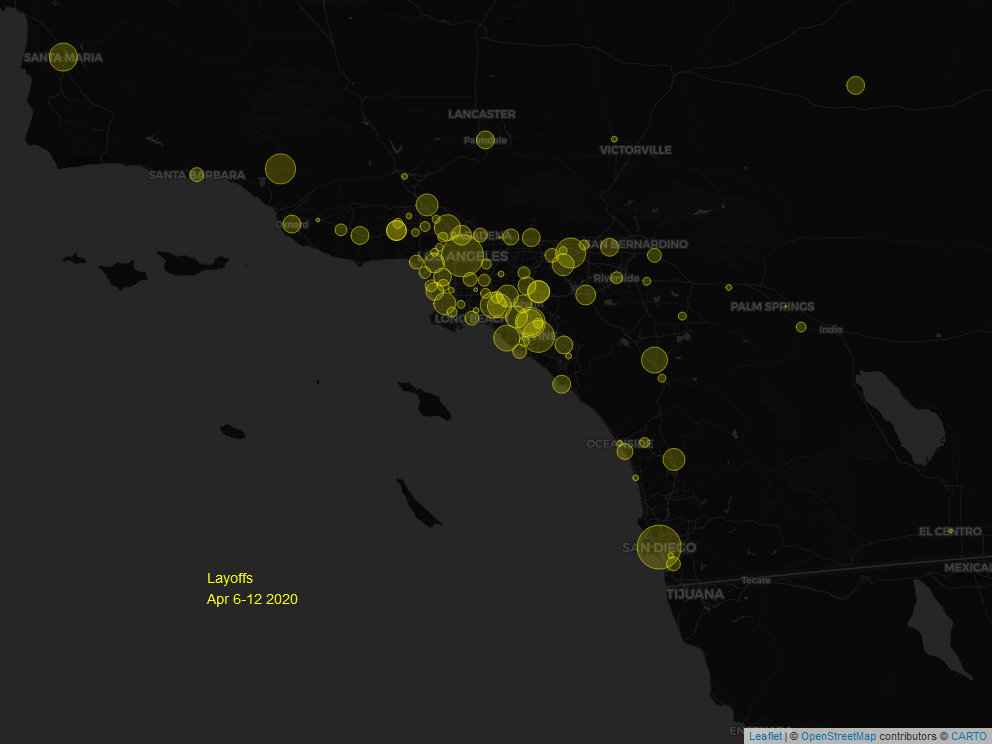
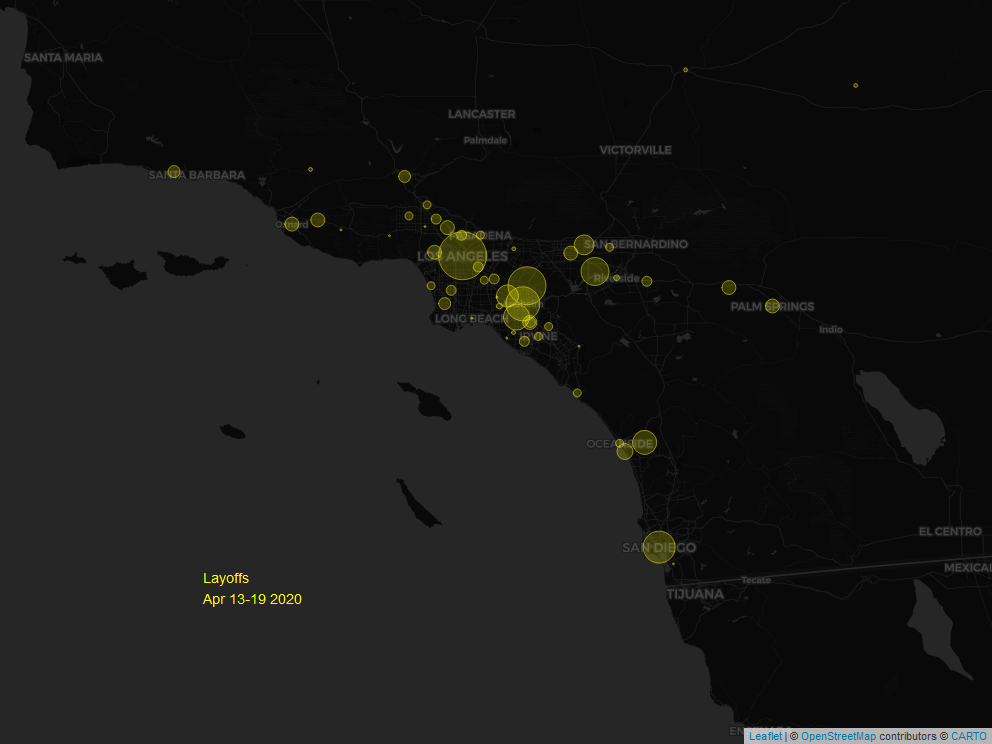
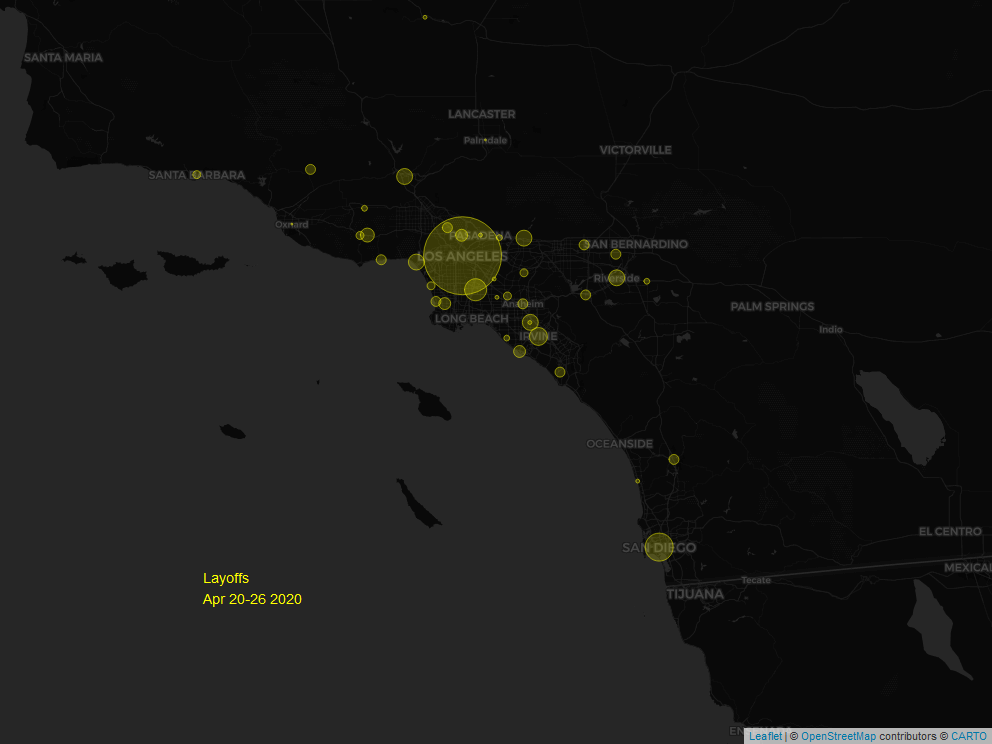
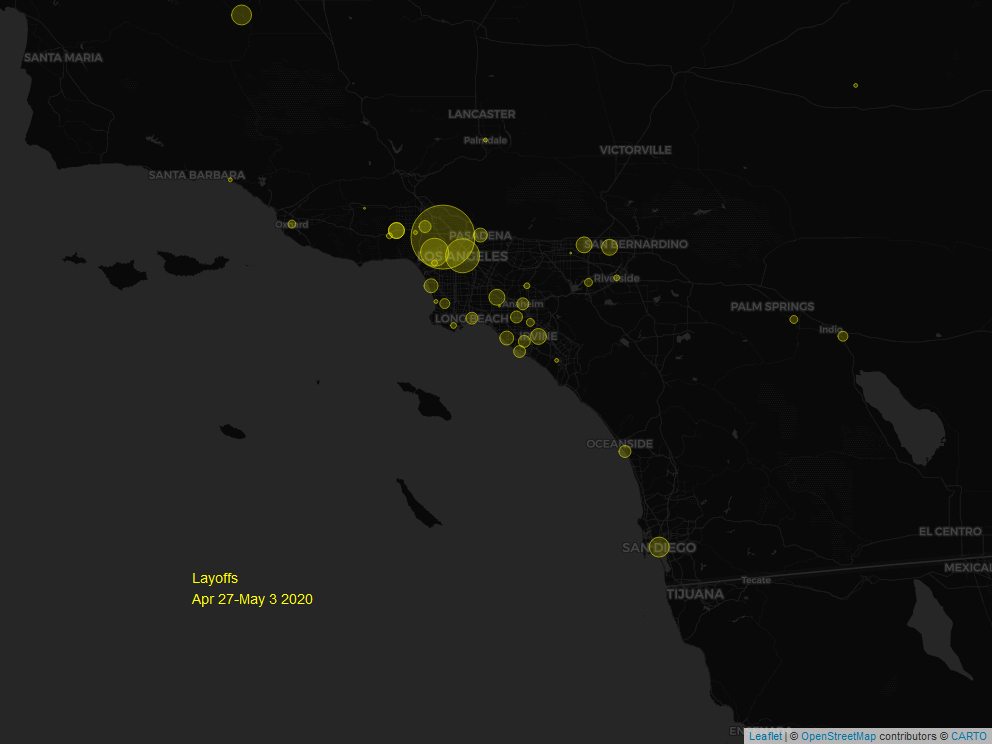
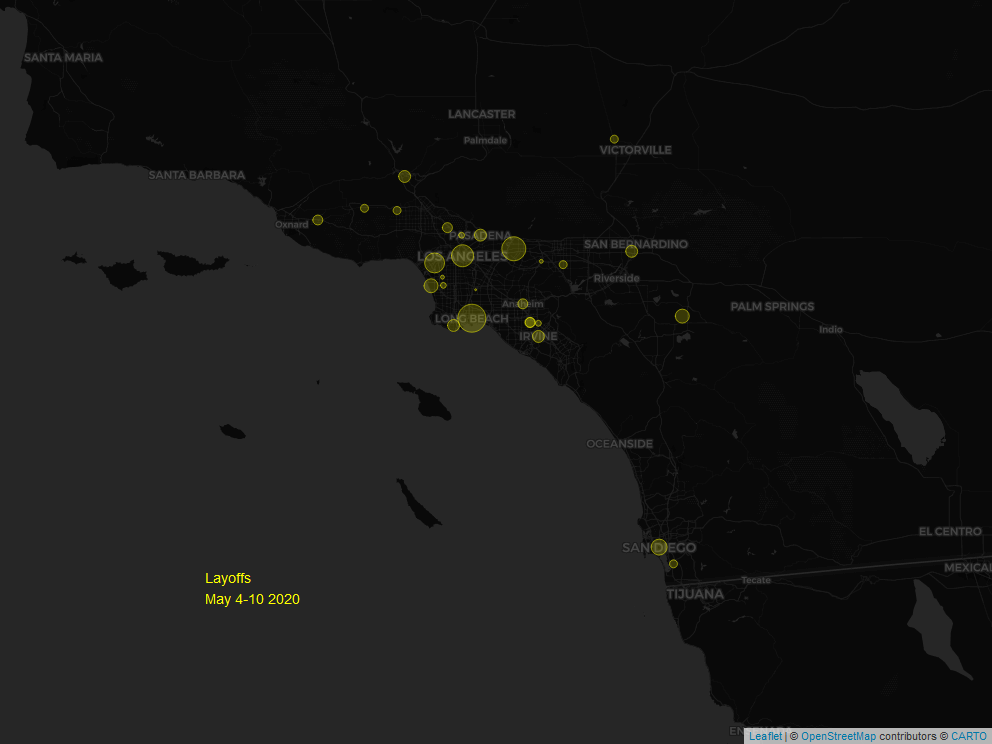
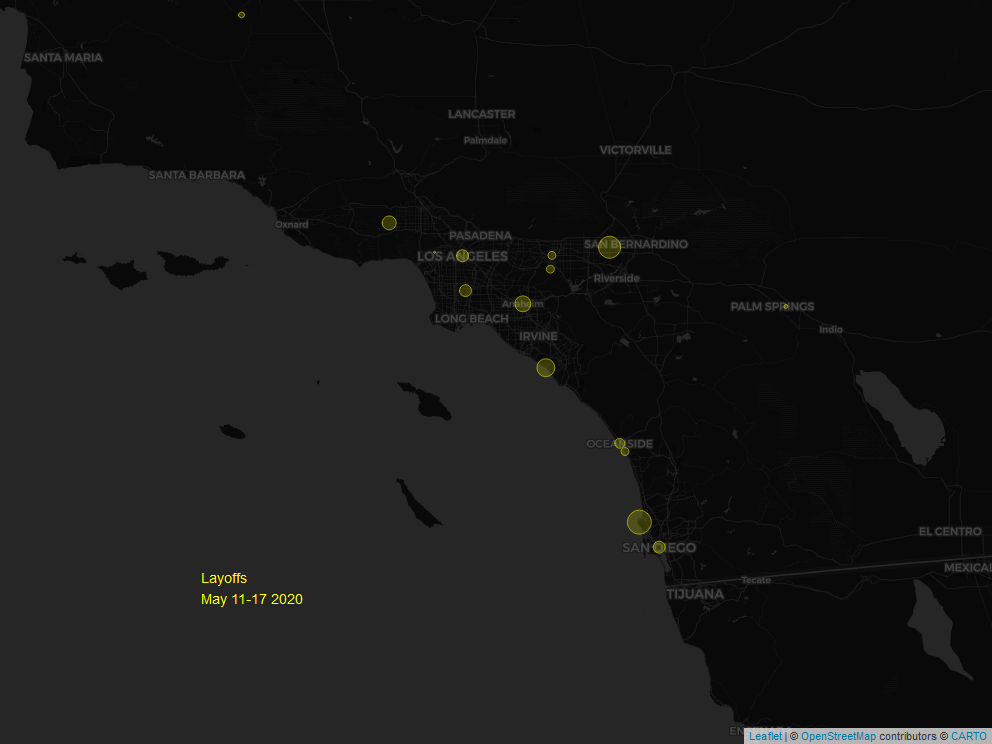
Weekly layoffs, COVID related
Shows progress in SoCal cities in March/May 2020.EDD data is WARN notices for temporary/permanent layoffs by effective date
ETL with R, dplyr, leaflet, geocoding.
San Diego County COVID map by zipcode
below is a smartphone demo of the app
R, Shiny and echarty
a dashboard with map and charts linked on hover
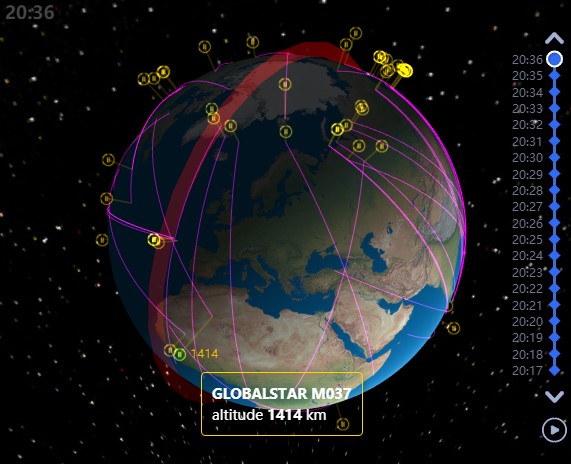
Spacewalk with R and echarty
Interactive 3D application with ECharts 3D Globe featuring:• real-time satellite data filtered by altitude
• charts: scatter3D for satellite location, bar3D for beams and lines3D for tracks
• controls: hover icons, timeline play/stop, animations toggle, zoom/rotate globe
• published as live demo
California fishing maps
Live interactive Leaflet maps with feature filtering, an ETL project- Extract - data collected from various sources like web tables, PDF files, Excel.
- Transformation - clean data from redundant rows and columns, recode GPS coordinates, reformat to csv/data.frame/geoJson.
- Load - build web page and maps with overlays, load data from files or inserts, solve CORS issues.
Rivers & Lakes
Ocean
Shark Attacks
Chrome Extension
an extension for Chrome browser for efficient download of photosLists Compare
comparison analysis of two long data lists, in JavaScript - LIVEPostgreSQL migration
a report of database migration from SQL Server to PostgreSQLSoftware Notes
Solutions to common problems in R, Javascript, Windows.© helgasoft.com