Helgasoft
Back

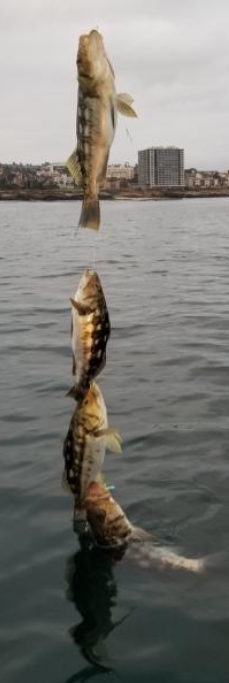
San Diego ocean fishing statistics

Data for this study was collected from website sandiegofishreports.com.
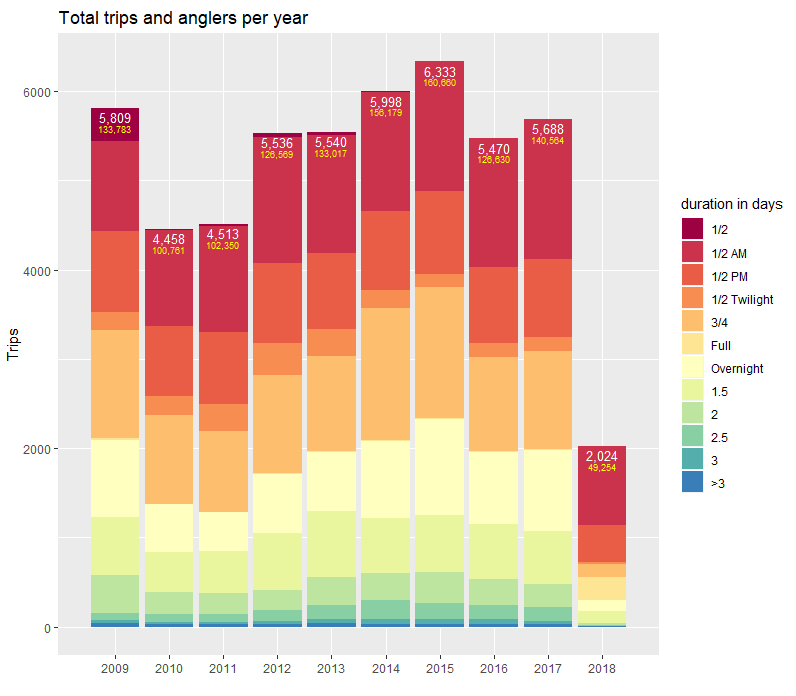
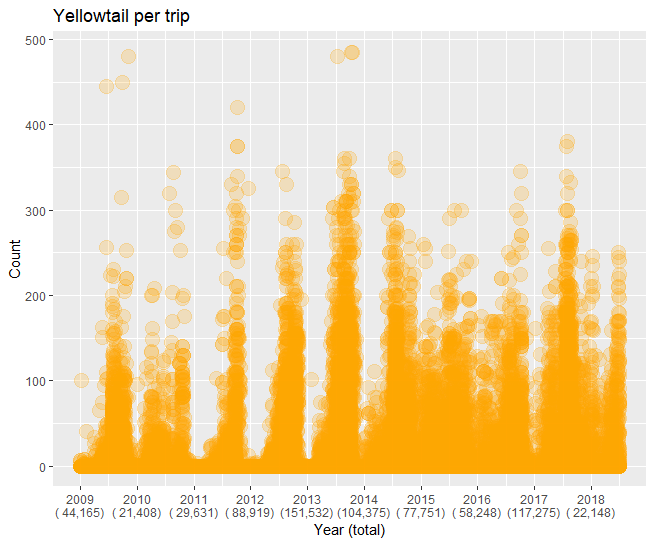
It includes daily trip reports by San Diego recreational fishing vessels from January 2009 to end of June 2018. Each report consists of starting date and duration of the trip, boat name, number of anglers and fish count by species.
The amount of data is considerable - 109 boats with 51,422 fishing trips in 9.5 years, with a catch of 89 ocean species.
 

Data preparation and analysis was mostly done through R library dplyr. Charts were generated with R library ggplot2 and library formattable was used for the two tables.

Tables

Boats by total catch

Boats scored by fish ratio and trips
 
 
The chart above gives an overview of the fish species being caught on half-day trips. It represents quantity proportions, not quantities. The spike seen on July 22, for instance, corresponds to more Rockfish and Sculpin caught than Calico Bass. Data for that day is shown on the right.
If updated daily, the chart could help fishermen target the most abundant fish type.
July 22, 2018
Calico 84
Rockfish 262
Sand Bass 40
Mackerel 0
Sculpin 115
Barracuda 12
Other 42


  Comparison by year, month and fish type


Bluefin   Yellowfin   Yellowtail 1+ days   Yellowtail half-day   chart

© helgasoft.com